Individuals and X-bar R Control Chart Template
Individuals and X-bar R Control Chart Template
Couldn't load pickup availability
Downloadable Excel template for use today
--
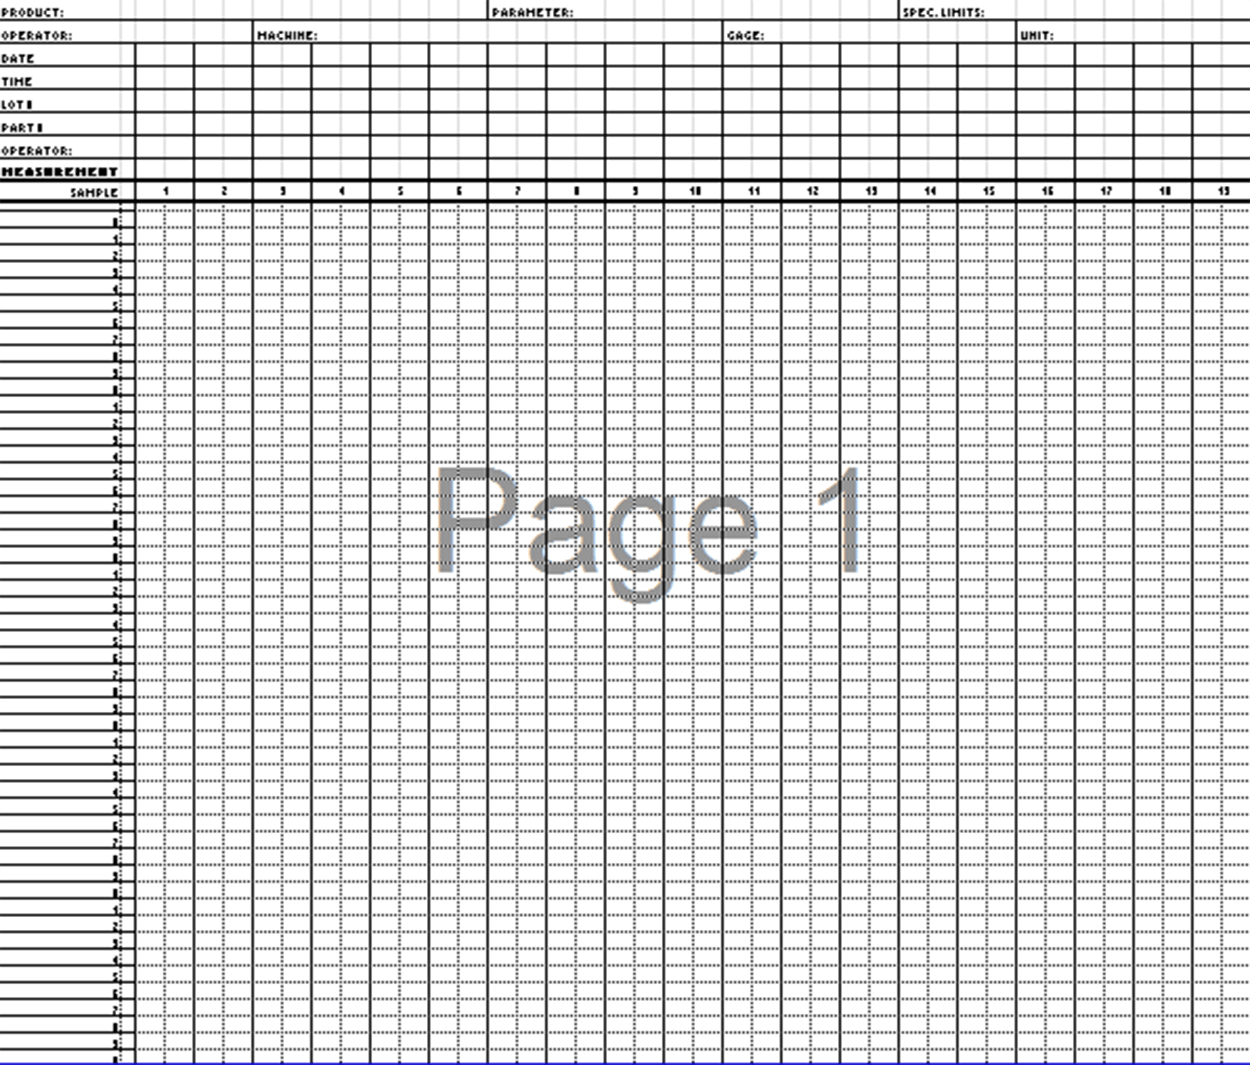
Use this Microsoft Excel template for implementing SPC by hand with these Individuals and X-bar and R charts (two worksheets). These variable charts, used as a pair, plot the mean and range of subgroups taken from your process.
This X-bar and R chart has room for up to 5 samples. The intent of the form is for the user to modify the scales on the left, then print it out for manual control charting.
Note that no calculations are performed by this spreadsheet. It is a template of a form to be used to enter process data so manual process charting can take place in time.
It was developed for engineers and others who want to save time in setting up such templates
The template does not include an MR chart. Most out-of-control points identified on a Moving Range chart are usually easy to identify on the Individuals chart.
The template is yours to edit and customize as you choose, or simply use it as is. No expensive software to purchase, just a simple solution to your needs.
This template is exactly what you would create on your own, if only you had the time. We have done all the hard work for you, so just follow these simple steps...
- Purchase and download the Excel spreadsheet template
- Edit the footer with your company logo
- Perform the study and enter the appropriate data into the boxes
- Review your results and improve your process!
[caption id="attachment_17712" align="alignnone" width="1250"]
 Sample image for tools[/caption]
Open Source Six Sigma
More products from iSixSigma


