

Control Charts Training Slides
Control Charts Training Slides
Couldn't load pickup availability
SPC is the application of statistical methods to identify and control the special cause of variation in a process
--
Control Charts are a key tool in any Six Sigma initiative, and the cornerstone to a strong quality organization. There are numerous charts with lots of calculations.
This course simplifies the understanding of Statistical Process Control (SPC) by providing the formulas and detailed explanation of each chart, and how each data point is derived.
Note: There is a prerequisite for this course. Learners must be familiar with the concepts taught in the Capability Analysis Course, such as: Mean, Standard Deviation, Histograms, Capability Indices (Cp and Cpk) and the Normal distribution.
How long would it take you to develop your own course? Hours? Weeks? Unless you can develop a similar course in less than an hour, this course will pay for itself at least ten times over!
The course is yours to keep. Feel free to edit, change or modify however you want, or don't change a thing
and teach directly from our material.
Click here to download some sample slides >>>
No recurring costs, no "per student" charge, and no special software to download. Your employees can refer back to it anytime they like. Send it in a global email to everyone in your company, if you'd like!
Don't spend thousands of dollars hiring a consultant to come in and speak in general terms.
Use your knowledge of your company's major problems to elaborate on the material we have put together.
Unless you can show how these concepts relate to actual issues that your employees deal with, you will have a hard time making much of an improvement in the way problems are resolved.
This course has been utilized many times in various industries, and is exactly what you would create on your own, if only you had the time. We have done all the hard work for you, so just follow these simple steps...
- Download the Powerpoint course from our website (did
we mention our courses are only $99) - Edit the master slide with your company logo
- Skim the speaker notes, maybe add a few of your own company specific
examples - Start training your company!
Course Outline:
- What is SPC?
- Control Chart Basics (Special vs. Common Cause)
- Out of Control Conditions (Nelson Run Rules)
- SPC vs. SQC
- Individuals and Moving Range Chart
- Central Limit Theorem
- X-bar and Range Charts
- Advanced Control Charts (EWMA, CUSUM and Normalized/Target charts)
- Attribute Charts (p, np, c, u charts)
- Final Points
- Reference Section (Chart selection guide)
Not convinced yet? click here to download some sample slides >>>
SPC is a preventative tool to:
- Assess the consistency of a process
- Monitor a process to determine when it has changed
- Reduce variation in a process
[caption id="attachment_17446" align="alignnone" width="933"]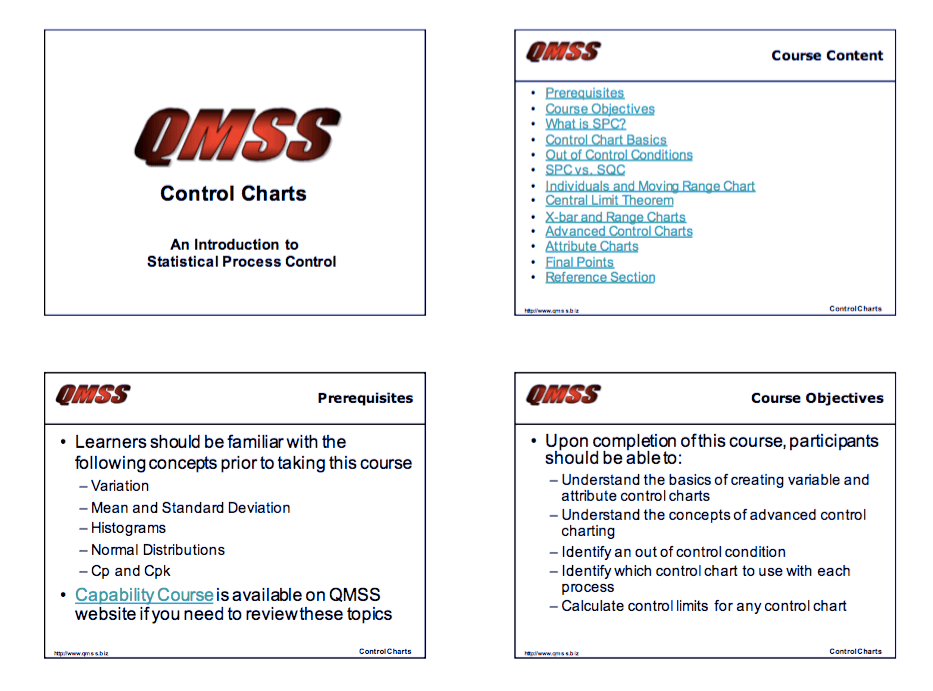 Sample image for training slides[/caption]
Open Source Six Sigma
More products from iSixSigma